ONLINE ADVERTISING AND CONTRIBUTION OF ARTIFICIAL INTELLIGENCE
Introduction:
Online advertising can be referred to as the promotion of goods and services over the internet to the target customers. In the year 2016 it was estimated that 3.5 Billion of the world’s population which roughly translates to 45% of the world’s population has access to the internet , with China leading the pack. With continuous development in the area of Machine learning, Artificial Intelligence (AI) and data science technologies online advertising continues to get sophisticated with time. This study was carried out to understand the procedure to carry out an online advertising and the impact of AI and in online advertising.
Objectives of the study:
To study important types of Online advertising
To understand the procedure and cost involved in online advertisement
Impact of AI in online advertisement with reference to NETFLIX
Chapter 1: Eight popular forms of online advertising:
Display Advertising
Display advertisement is a paid form of advertising. Frequently used forms of display ads are banners, landing pages (LP’s) and pop ups. Unlike other advertisements these advertisements do not show up under Display search results.
Most commonly found on websites and blogs their purpose is to redirect user’s attention to the company’s product. Working together with remarketing display advertisements are very successful. According to Digital information world, “website visitors who are re-targeted with display ads are 70% more likely to convert on your website.”
SEM and SEO promote content and increase visibility of the advertisement through searches.
SEM: In this type of advertising the payment for the advertisement is decided based upon the number of times an individual clicks the advertisement than for the actual advertisement. These advertisements appear on the search engine results page. The business usually pays the search engine in order to display the advertisement in their search engine result page (SERPs). The relevance of the ads displayed in the results page are based on the key words used in the search engine by the individuals alongside the results for the queries.
SEO: It is the combinations of techniques used to promote a web site to the top of the search engine results based on algorithms and other organic techniques like linking etc. Without involving payment to the search engine provider.
Native Advertising
Native advertising is a form of paid advertising, these ads blend into the media format in which they appear. They are often found in social media feeds or recommended content. The key feature of Native ads is that they are non-disruptive as they look as a part of the web page unlike banner ads or display ads which are easily recognized as advertisements by individuals.
Pay Per Click (PPC)
As the name suggests, the cost of these advertisements is based on the number of individuals who click on the ads and not based on the number of times the ads was seen or appeared to the individuals. Even if 100 individuals have seen the ad but only one person clicked it the cost revolves around the one click only. These ads generally carry an attractive tagline and an Image. It is worth noting that 64.6% of people click on Google ads when they are looking to make an online purchase.
Re-marketing
Re-marketing (or re-targeting) is a type of online advertising that brings the ad around the individuals multiple times. In this technology the site drops an anonymous browser cookie and literally follows the user around the internet and sends information to the re-marketing service provider on when the individual can be re-targeted. Statistics show that only 2% of web traffic brings positive results on the first visit, which means 98% of users leave without converting right away.
Affiliate Marketing
It is a form of advertising where the product of a company is promoted by affiliates targeting the same customer group. It works on a commission basis for every product sold by the marketing effort of affiliates of the seller. This form of advertisement is popular among bloggers and other individuals who have a significant number of followers who are looking forward to making a passive income.
Chapter 2 – Procedure and cost involved in online advertisement:
Advertising on Facebook – Fb ads manager:
Advertising on Facebook is managed through Facebook business. The ads can be created and managed through Facebook business which gives various details about the performance of the advertisement and cost incurred. Facebook business allows the user to classify the advertisement on the basis of categories as follows:
– Awareness
Brand Awareness – Increases awareness by reaching people who might be interested
Reach – Making sure the advertisement is seen by maximum number of people
-Consideration
Traffic – Maximum visit to the target website of page
Engagement – To get more people to engage with the ads through likes and shares
App installs
Video views
Lead generation – Drives sales through collection of e-mail ids of interested parties
Messages – Boosts conversation through messenger
-Conversion
Conversions – Drive valuable actions in websites and through messenger
Catalog sales – Ads based on the products in the add publishers product catalog
Store visits – Promotes people to visit the brick-and-Mortar stores
Budget and Bid:
Budget can be daily budget – Cost fixed on a daily basis and Lifetime budget which will be utilized for the entire lifetime of the campaign.
Bid: Every ad displayed in Facebook is a result of the ad winning an auction to win its spot. The advertisement is valuated on the basin of:
Cost – The cost paid for the ad
Relevance – The relevance of the ad to the target
Estimated action rate o the ad publisher
Facebook follows country based pricing and the average cost of an “cost per click (CPC)” ad is Rs 0.52 and Rs 2.30 and average cost per 1000 impressions is Rs 9.30 with a minimum budget of Rs 40 per day.
Advertising on YouTube:
There are four categories of ads in YouTube with an average cost of Rs 0.70 to Rs 17 per click or per view and it depends on the quality and popularity of the video in which the ad will be displayed or played.
In-search ads – Advertisement appears above the YouTube search results
In-slateads – Advertisement appears in the suggested videos after your video ended
In-display ads –Advertisement appears on the suggested videos beside the video you are watching
In-stream ads – Advertisement plays before you can watch your video
Steps involved in YouTube advertising:
1. Google AdWords Account creation:
Primary step is to create a Google Adwords account which helps in creating and managing the advertisement campaign and the budget. Google Adwords is an online platform that users Pay to display various forms of advertisements within the Google ad network to the web users.
2. Link AdWords and YouTube
AdWords and YouTube accounts should be linked together. It can be accomplished from the navigation menu by clicking “Linked YouTube accounts” in Google Adwords page.
3. General Settings
In this step the desired budget per day is fixed. It is recommended to start small and scale up. No payment is made to Google unless the viewer watches the ads all the way through. There is also more customization that can be allotted for bidding for the advanced advertisers.
4. Set the Locations for the Ad to Show Up
This deals with the selection of countries, cities, regions, IP addresses, etc, going as broad or as specific as the marketer would like. The more specific, the better qualified viewers will be targeted. To build brand awareness, being broader in selection might be helpful.
5. Upload Your Video
Next step involves the selection of the video that has to be showcased. The video to be showcased is uploaded to Google Adwords account from YouTube. Therefore, in order to showcase the advertisement the video has to be first uploaded to YouTube.
6. Advanced Settings
This steps allows the marketer to choose what days/time of the day the ads are to be shows and if there is a specific time to showcase the ads because a prospect is more likely to be compelled by the product, and the start and end date for your new ads.
7. Device Targeting
Through this option one can choose specific devices they want to target, whether it be mobile, desktop, laptop, tablets, etc. One should select the devices based on what the target viewers might use when searching for the product advertised.
8. Selection of demographics, topics & More
Here the marketer selects age, gender, and narrows down on what topics the ads should be shown. Better results can be expected on being more specific in these selections..
Being more specific with categories, words, websites, interests, and phrases the ads are to be shown, the audience will be better targeted.
9. Choosing Keywords
The Google Keyword Tool can be used to find relevant terms and specific keywords that the potential customers will use in searching for on YouTube. These keywords help in targeting the right individuals more efficiently and get as specific as possible. These terms are from Google’s search engine, not from YouTube. They can still be useful in cutting down on some of the keywords that could cause the ad to be viewed by the wrong person.
The longer the keyword, the more specific it is, and the more pertinent it will be to the business in capturing the right viewers.
Chapter 3: Impact of AI in online market with reference to NETFLIX:
Netflix began in the year 2007 offering video-streaming of its content to its subscribers. The company capitalized on the shift of viewers from regular cable television shows to media contests online. This move was accepted across the subscribers, technology enthusiasts and wall street analysts alike.
Netflix conducted a contest “Netflix grand prize” in 2009 and offered a reward of USD 1,000,000 for the best algorithm for predictive analysis of the viewers rating for a movie based on past ratings. During this stage there was a limitation on the level of data available about the viewers for the analysis. Apart from Cust ID, Movie ID, past ratings and the date and time the movie was watched there was no other data compiled.
With the launch of streaming as the primary mode of delivery there was scope for many other data points to generate date including but not limited to the time and date on which the movies were watched, time spent on selection of movies and the number of the times the playback was stopped and the causes for the pause and its effect on the viewers experience based on the ratings. Using these data Netflix has built models the differentiate their customers based on many scales and provides them with best offers and suggestions to customize their enterprise behavior to become more customer -centric in their approach.
Use of Big data and Analytic in Netflix:
Predictive viewing habits:
The core of the efforts made by Netflix is to provide its customers with the best set of movies they might enjoy streaming. Netflex has employed people called “taggers” who are requested to watch the upcoming content and flag them into various categories based on the elements in the movie. Based on this input from the taggers Netflix brings up the list of suggestions to watch other productions which were tagged similar to those which were enjoyed by the viewers in the past. Netflix have created around 80,000 new “micro-genres” of movies based on the viewing habits.
Netflix records the following data as well:
When the viewers pause, rewind or fast forward
The relationship between the day and the content screened
The date and time
Area from which the streaming takes place
Device used for screening
Pausing and non-resuming of content
Ratings of the content
Keywords used in search
Browsing and scrolling behavior and others
They use these data for predictive analysis of customer behavior and help in maintaining a healthy CRM relationship.
Moving from content distributor to content creator:
This shift of Netflix towards content creation was also based on the extensive data analytic. Netflix identified that the subscribers had a very strong preference towards the content directed by David Fincher and starring Kevin Spacey. Netflix bagged the rights for House of cards after outbidding HBO and ABC. They banked on this production to be the “Perfect TV show” based on their predictive model and they immediately launched two seasons of 26 episodes.
The scale on which Netflix would want to see their customers improve is the time spent by the consumers in streaming the content. This aspect of suggestion of content demonstrates the customer-centric approach followed by Netflix.
Quality of experience:
Netflix monitors the quality of experience of the viewers and its effect on the behavior of the user. The primary aim is to reduce the lag in streaming the consumer’s experience. From the physical location of the users Netflix measures how the viewing experience can be optimized through placement of data. Information on the causes of delay, whether it is due to buffering and/or bit rate. The use of Big data and analysis have helped Netflix to position themselves as the leader of the pack. Netflex follows the approach of various other distributors and production networks combined with innovation and efficient handling of data.
Defining future plan of action:
The CRM practices of Netflix is highly dependent on the insights collected from their customers coupled with innovative techniques and Analysis CRM to improve their business.
The other area in which Netflix outperforms is tn optimization of marketing campaigns. They target the customers based on the time spent by them across various electronic devices. It is done through the time spent streaming Netflix through various devices. Based on this information they perform ad campaigns that will return the highest ROI for Netflix. Netflix has a minimum of 80% success rate compared to 30% to 40% for other networks. These ads are set up using various data mining tools and building complicated algorithms to identify the behavior of the customer and the likelihood of them attracted to the content offered to increase the success rate.
Conclusion:
Online advertising is constantly growing in a steady phase and more so the technology involved in placing these ads in various online platforms and targeting the right set of audience remains the key factor to increase the success rate of any form of advertisement. In order to achieve optimization of ad placements development in technology especially in the area Machine learning and AI has been proved to be a tremendous advantage to the marketers. Hence, the marketers should constantly incorporate the best strategy based on their marketing objective to derive best results from their ad campaigns across various online platforms.
It can be safe to believe that accounting can be tracked back to the days when money was introduced as a medium of exchange in business transactions. There are various sources of ancient literature that support recording of business transactions as early as 7500 BC in the Mesopotamian civilization[1]. Luca Pacioli has been regarded as the father of the modern-day accounting as most of the accounting practices of today was portrayed in his in his book Summa de Arithmetica, Geometria, Proportioni et Proportionalita (Everything About Arithmetic, Geometry and Proportions) as early as 1494[2]. With the growth of complexities and the size of business accounting has also been continuously been evolving along with the nature of business and in order to full fill its purpose. In todays’ scenario accounting is not seen as a mere recording of business transactions but its purpose extends up to the stages of making crucial decisions in the business. It is also used by various individuals and entities to analyse various aspect of the companies and to compare their performance against their peers and the industry. It is also important to note that for a publicly listed companies in majority of developed and developing countries, it is a mandatory requirement for them to audit their financial statement at regular intervals as per the law. Generally, every company is to audit their accounts at least once in year. Therefore, accounting as has come a long from being just a record of transactions to being able to provide a true and fair picture of the financials of the company if practiced effectively.
In present days a company’s financial health is analyzed by using the financial statements which are prepared as a part of accounting process. Financial statements comprise of i. Statement of Profit/Loss or Income statement of the company which brings out the information of the operational activities of the company for a particular time frame. ii. Balance sheet, is built upon the accounting equation Assets is the sum of Liabilities and Owner’s equity. The balance sheet of a company portrays the details of what the company owns and what the company owes. Balance sheet bring out some of the very crucial information about the company which will be used for analysis. iii. Statement of Cash flows shows the movement of cash inflow and outflow in the company this information is vital in understanding the sources and uses of cash and gives a broader understanding about the activities of the company. In this research the author has brought out the Key Performance Indicators (KPIs) of the financial health of a company which can be obtained from the financial statements of the company and their implications.
Major indicators of financial health of a company implemented in this study:
In order to analyse the Financials of a company the following measures can be applied to identify the trends in the financials of the companies.
Ratio analysis:
Ratio analysis is one of the simplest and effective measure of financial strength of a company’s financial statements. There are various ratios, however, in this study the Key ratios that were analyzed were i. Liquidity ratio, ii. Activity ratio, iii. Ownership ratio, iv. Profitability ratio and v. Operating ratio.
Liquidity ratio:
Current ratio: It gives the ratio between the current assets of a company to the current liabilities of the company. This ratio brings very significance reference to the effectiveness of the company in meeting its short-term payments and in carry out the day to day operations of the company. The ideal current ratio is recommended to be 2:1, however these recommended figures are expected to change from industry to industry and it also depends greatly on the nature of the business.
Liquid ratio (acid test): It can be understood as a variant of the current ratio. Liquid ratio gives the ratio between Cash, Trade receivables and marketable securities over the current liability of the company. It is denoted as an acid test ratio because it portrays the ability of the company in meeting its unexpected short-term expenses. The ideal bench mark of an acid test is recommended to be 1:1.
Activity ratio:
Accounts receivable turnover ratio: It is also known as “Debtors turnover ratio”, it gives count of average account receivable collected by the company over a given period. It is calculated by dividing the net credit sale for the period by average accounts receivable i.e {(AR in beginning + AR at the close)/2}. This ratio also helps in calculation of AR turnover in Days, which gives us the approximate number of days the consumers take to pay their debt to the company. It is calculated by dividing 365 by the AR turnover ratio. A higher turnover ratio means the company is efficient in collecting its debts and the there is also average time taken by the consumers in re-payment of debt to the company is less.
Inventory turnover ratio: This ratio brings the number of times the company has managed to convert its average inventory to sale. It is calculated by dividing the annual sale by average inventory i.e {(Opening inventory + Closing inventory)/2}. The idea behind opting for average inventory over of closing inventory is because the company’s inventory value tends to be fluctuating over the period. A higher inventory turnover shows that the company is very effective in converting its inventory to cash and the liquidity of the company is not hampered due to the inventory the company holds however, a higher turnover can also mean that the company is not having enough inventory in place to meet its demands. While a lower inventory turn over indicates that the company requires more time to convert the inventory to sales or it could have its working capital locked up as inventory. It should also be noted of all the current assets inventory is the least liquid and it also suffers from the risk of fall in demand and change in consumer preference.
Asset turnover ratio:It brings the efficiency with which the company uses its assets. It is calculated by dividing the net sales by Total assets of the company. A higher ratio indicated the company is using the assets effectively in generating its revenue.
Ownership ratio:
Debt – Equity ratio: As the name suggests this ratio brings the proportion of debt to the equity in the capital structure of the company. A higher ratio states that the company is highly leveraged by employing more debt in its capital structure. Higher debit in a company’s capital structure also requires the company to make periodic payment for the debt employed any default in these payments may lead to lenders filing for bankruptcy. On the other hand, a low Debit-Equity ratio indicates that the company has very less debt in its capital structure and the risk of default is less. However, it should also be noted that the company is not utilizing the cheaper source of capital. In order to calculate the ratio Total liability of the company is divided by total share holder equity of the company.
Debt ratio: It the proportion assets financed through the short- and long-term debts of the firms. It is calculated by dividing the total debt of the company by total assets of the company. A higher ratio indicates that the firm is highly leveraged, and a substantial portion of the assets is funded by debt.
Profitability ratio:
Gross profit ratio: The percentage of Gross profit to sales is represented in this ratio. A higher gross profit ratio indicates that the company has manages its direct cost efficiently and can make good profits if it controls its indirect and over head costs. It is calculated by dividing the gross profit by sales and multiplying by 100 in order to arrive at the percentage.
Net profit ratio: Like Gross profit ratio Net profit ratio provides the percentage of Net profit over the total sales of the company. A high Net profit ratio indicates the efficiency of management and ability of the company to keep the overall cost in control. Net profit divided by total sales gives the Net profit ratio of the company.
Return on Equity (RoE): Net income of the company divided by Total shareholder’s equity gives the Return on Share holders equity. This ratio is also expressed as a percentage. This ratio is generally compared with the industry bench mark to analyse the company’s financial performance over the period.
Return on Capital employed: This ratio is very close to RoE discussed above, in this ratio the entire capital employed by the company inclusive of debt capital is considered along with the Equity and reserves. It helps in analyzing the overall effective use of the capital by the company.
Leverage
Operational Leverage: It brings the relative change in Earnings before Income and Tax (EBIT) to a change in Net sales. A company with high fixed operational cost tends to be leveraged operationally and a small change in the sales will have a magnifying effect on EBIT of the company. Capital intensive companies generally incur higher level of fixed cost compared to a labor driven company. Degree of operational leverage is calculated by dividing the contribution of the company by EBIT (Sum of Net income, Interest and taxes). A company highly levered is faced with the risk of cash flow problems during times of economic slow down as a small fall in sale brings a magnified fall in EBIT of the company. Degree of Operational leverage can also be considered as a proxy of the firm’s business risk as it magnifies the effect of sales in the EBIT of the firm.
Financial Leverage: Infusion of debt in the capital structure of a company is termed as financial leverage. Degree of financial leverage portraysthe relationship between EBIT and Earnings per Share (EPS). A high degree of financial leverage shows that a small degree of change in EBIT has a magnified effect of EPS. Degree of financial leverage is calculated by dividing the relative change in EPS by change in EBIT of the company. A high degree of financial leverage shows that the company has higher composition of Debt or fixed cost capital in its capital structure which demands regular cash flows in order to pay the interest expenses incurred on the fixed cost capital employed by the company failure to do so may lead to catastrophic results for the company.
Combined leverage: Combined leverage is applicable when the company used both operational and financial leverage in order to magnify the effect of change in sales on the EPS. Combined leverage is the product of operational and financial leverage. Combined leverage can also be calculated by dividing the contribution by Profit earned before tax. The degree of combined leverage portrays the relative change in EPS to the change in the volume of sales.
Operational leverage shows the degree at which the firm is incurring fixed cost to its total operating costs at various sales levels. Operational leverage magnified the impact of change in sales on the EBIT of the company. Financial leverage evaluates the changes in Net income of the company to the changes its net operating income. It can be stated that a firm’s operational leverage is a result of the company’s choice of technology i.e fixed or variable cost while the financial leverage is depended on the company’s capital mix i.e mix of debt and equity capital.
”An establishment authorized by a government to accept deposits, pay interest, clear checks, make loans, act as an intermediary in financial transactions, and provide other financial services to its customers.” – Business dictionary[1]
The above defination brings out the key aspects of banking which can be broadly classified into acceptance of deposits from public, make loans and act as intermediary to the public in various ways. With this broad defination this essay has been drafted to bring ou the Challenges and opportunities in the Indian banking sector.
Challenges in Indian banking sector:
Banking system across the globe has be challenged by the global economic slow down and the Indian banking sector is no exception to this case. Apart from the global economic slow down the following factors also have a significant impact on the Indian banking system.
1. Non-performing asstes:
‘Non-performing asset’ (NPA) is defined as a credit facility in respect of which the interest and/ or instalment of principal has remained ‘past due’ for a specified period of time. From 31st March 2004 the specified period which classifies the asset as a NPA was set at 90 days since the date on which the payment to the bank falls due.
In the past decade the NPAs in India have increased in an alarming rate and stand as a significant hurddle to the economy compared to the NPAs in other countries. CARE has ranked India as the 5th with the largest NPA levels. RBI on 28th Aug 2018 have stated that in India the NPA levels are 12.1% of the of the gross advances made by the end of March 2018.[2]
NPAs cannot be regarded as the failure of as asset to yield returns alone it can also be taken as a sign that there is an economic slow down in the country. The 4 other counties ranked over India by CARE on largest NPA levels are Greece, Italy, Portugal and Ireland and all of the these counties have battled severe debit cricis in the recent past.
One of the predominant ways in which major countires have fought NPAs were through creation of state owned asset management companies to manage them and buy reducing the tax rates. The other major reform carried out buy the countires was the securitisation of debit to equity in prospective businesses.
2. Monsoon and weather:
Agriculture plays a major role in the Indian economy. Every farmer is linked with the banks mainly for loan purposes. The Monsoon and climatic conditions in our country is becoming more and more unpredictable that these farmers lose their produce at adverse situations. This in turn results in them not being able to pay back their dues to the banks and thereby piling up the NPAs of such banks. This is more prevalent in states such as Utttar Pradesh, Tamil Nadu, Maharashtra etc. This is a major challenge to public sector banks rather than private banks as they refrain from lending to farmers. The poor recovery of such loans and the former Government’s decision to waive all loans to farmers, by the former government cost around Rs.10,000 crores to the banking sector. Banks cannot possibly take even precautionary steps to abstain from such situations.
3. Gaining People’s Trust:
Banks are institutions that deal with people’s hard earned money. The main reason why people of the previous generation found it hard to deposit money in banks is due to lack of trust. But eventually banks especially public sector ones evolved to gain people’s trust. The scenario is going south at present due to various scandals that are emerging one after the other in the banking sector. Businessmen who borrowed huge sums of money failing to pay their debts, slander in the top management, alleged inside involvement in frauds etc are recent events that has come to light. These circumstances make people feel that the common money lost in such scandals are part of their deposits. The recent FRDI bill created chaos among people that their deposits were at risk. Only after extensive awareness initiatives by banks this issue came to a halt. These kind of news has the tendency to affect human psychology adversely and thus, gaining back people’s trust after such events proves to be of a greater challenge to banks.
4 . BASEL III and Capital Adequacy Ratio (CAR) minimum requirement:
RBI has notified all Scheduled Commercial banks to maintain a minimum CAR of 11.5% inclusive of Capital Conservation Buffer (CCB) by 31st March 2019.[3] The Government of India has been involved injecting capital into the banking structure in a phased manner through a scheme ‘Indradhanush’ to meet the above requirement. The increase in CAR is expected to reduce the ROE and with the BASEL III norms restricting the banks from enjoying higher leverage the cost of capital for the banking sector can expect to increase.
5. Cyber threats
With the advent of smart phones and the ease in internet accessibility, customers are relying more and more on the digital channels for their banking needs. Simultaneously, anti-social elements have also increased considerably. As a result, cyber crime has become a huge threat to the banking system. The FSR had labelled cyber-risks as a high risk zone for India’s banking sector. This came to light when a massive data breach of 32 lakh debit and credit cards happened in 2016. Some of the common attacks include phishing, vishing and social engineering. In the last 5 years, the volume of bank fraud has increased by 19.6%.
6. Knowledge engineering:
AI in banking is on the uprise, in the last few years. But for a diverse nation like India, the various languages and the lack of credible data seem to be challenging. There are many potential risks in the AI implementation if the data sources are incorrect. The structured mechanism of Artificial Intelligence cannot operate without the right kind of data, especially systems like fraud detection AI or KYC compliance AI system. Also, the need for skilled personnel is apparent in the face of scarcity of trained human resources.
7. Cash crunch:
In the months of April and May this year the news of cash crunch hit the national media with ATMs not able to dispense cash demanded by the depositors. This situation have said to have arised in the nation due the slowing down of deposits due to investments channeled towards other asset atracticve asset classes over the bank deposits probabily due to lower interest rates and the panic that has hit the public with respect to the FRDI bill. The Economic Times reported that bank deposits grew by 6.7% during 2017-18, lowest growth rate since 1963.[4]
Opportunities in Indian banking sector:
Indian Banking sector is growing at a rapid pace with the increasing number of banks both public and private operating in the market. The following are a few opportunities that the Indian Banking sector can exploit to improve performance.
Financial Inclusion:
Financial Inclusion refers to making banking accessible to every single induvidual present in the nation. In the Indian scenario financial inclusion is often identified as a challenge rather than an opportunity due to the fact that the degree of variation present in the financial needs of the Indian population is huge. But the very fact can be turned into an opportunity by developing customised products that suit the varying needs. Such a step will increase the customer base of the banks thereby increasing the operations of the banks and consequently resulting in its growth, if handled with due diligence.
Financial Inclusion Schemes in India
The Government has been ardent in its objective to bring every section of the society under the purview of banking regulations. Following are the schemes that contributed towards achieving the same.
Stand Up India Scheme
Pradhan Mantri Mudra Yojana
Pradhan Mantri Jan Dhan Yojana
Pradhan Mantri Suraksha Bima Yojana
Atal Pension Yojana
Pradhan Mantri Vaya Vandana Yojana
Jeevan Suraksha Bandhan Yojana
Varishtha Pension Bima Yojana
Sukanya Samriddhi Yojana
Credit Enchancement Guarantee Scheme for Scheduled Castes
Venture Capital Fund for Scheduled Castes under the Social Sector Initiatives.
In addition to the above, demonitisation of the 500 and 1000 rupee notes made the common people understand the importance of holding a bank account and the LPG subsidy scheme actually made people belonging to the rural areas open and operate a bank account.
2. Growth of Technology:
The world today is becoming more and more tech-savvy with new inventions and innovations entering the market every now and then. Indian Banking sector is no exception to this universal phenomena. Growth of technology is seen by many as an hindrance to the everyday working of bank. But this notion is shared by the people who are resistant to change. With proper change management practices, this can be identified as a great opportunity for the growth of banking industry. We see how change has become inevitable in the present world. Growth in technology is one of the prime factors that has helped people adapt to the new changes occurring in the way of smart phones and other digital devices. This has made people more adaptable to the changes that happens elsewhere. Banking industry can make use of this opportunity to bring about reforms with respect to the products and services offered.
3. Innovations
With the enormous growth in the technology innovating has become simple at present. Customising banking products according to the needs of the consumers can provide for improvement in the performance of the banks.
4. Human Resources
Human resources decide the success of any enterprise. With the growth of technology and the present youth who grew-up along with this growth it becomes easy for banks to train its employees who are already aware of the nuances of the technology.
5. Artificial Intelligence
AI is the technology that tries to recreate human intelligence processes such as learning, reasoning and self correction in machines through way of programming. Induction of chat-bots in the customer service is the basic application of AI in the banking field. Implementing AI in the back-office operations of banks will help in reducing frauds and lower seciruty risks. According to Accenture’s recent Accenture Banking Technology Vision 2018report, 83% of Indian bankers believe that AI will work alongside humans in the next two years — a higher than the global average of 79%.[5]
6. Digital Indian campaigne:
With the recent reforms on the Indian govenment to promote cash/paper less economy through Aadhar which allows identification through biometrics, the distribution of LPG subsidary through banks, Implementation of GST in July 2017 and demonitisation the country has significantly moved towards the digital platform. The above mentioned reforms along with the growth of IT in the country gives a boom to the banking sector in terms of oppurtunities like e-KYC, digital signatures.
Digital India campaigne has also helped in a great extent to aid in financial inclusion of various catagoy of population who would not be a part of the formal banking structure if not for this campaigne.
With a digitally connected banking structure gives room for wide reach among the public and acts a great advantage in implementing any changes to the economy or the banking system.
Conclusion:
Though the Indian banking sector faces a considerable level of challenges it is necessary for a rapidly developing country to effectively over come those challenges and turn those challenges to the oppurtunities then capitalise on them to turn them into the strenghts of the system.
With continous economic growth in terms GDP and being rated as one of the fastest growing economy in the globe coupled with the extensive growth in Information technology and digitalisation campaign across the country a strong banking system is the need of the hour for the Indian economy to direct the growth in the right channel and have the desired effect on the economy through effective policies.
[2]NewsBusiness NPA woes may continue for banks in 2018-19 due to current economic situation: RBI IndiaToday.i, New Delhi, August 29, 2018, UPDATED: August 29, 2018 15:57 IST
In the present globalized scenario where every business has to be on their edge for survival in the long term the human resources play a vital role in archiving it. As of 2008 seventy percent of world trade was controlled by just 500 of the largest industrial corporations[1]. With the growth of MNC the diversity of workforce in an organization has also increased. This account to the major diversification in terms of different personality in the work force. The personality of an individual is influenced by culture, nationality, values and other factors. In this paper the researcher has examined two major classification of personalities, Lone wolf and Team player.
Objectives of the study:
To identify the nature of lone wolf personalities
To identify the reasons for being a lone wolf
To understand how to efficiently handle a lone wolf personality
Chapter 1: Nature of lone wolf personalities and team players
Lone wolf personalities are the personalities who prefer to be alone rather than in a group they are like a wolf that does not desire to be a part of the pack but is drawn to the pack by nature. The nature of these personalities cannot be generalize or stereotypical as ever person who is a lone wolf is different to a significant extent to another person who is also a lone wolf. Lone wolf personalities do not feel the need for acceptance among there peer group or colleagues this nature provokes them to be reckless and insensitive to the people around them. The major personality traits of lone wolfs are as below.
They are good listeners: They do not involve themselves in a conversation before listening. They make mental notes before indulging in any social situation and this helps them to make their views clear and talk with stumbling or carrying any element of doubt in what they say.
They are self sufficient: They are not dependent on the people around for their materialistic needs. They consider it to be a disappointment to depend on someone for their materialistic needs. This trait makes naturally develops them to be a rational decision makers. This nature also makes them feel empowered, as they know they can manage most of the situation ahead of them.
They are super focused and a power house at work: They are keen at observing even the smallest of changes and are keep their minds open for any non verbal cues. This nature also helps them understand the situation or their colleague better. It also turns them to be a power house at work, with their supreme level of concentration they are able to be stay focused on their goals and tasks which makes them very efficient and not easily distracted.
They are easy to satisfy and please: The lone wolf personalities do not generally expect a big party or having the lime light to appreciate them. As they are very self sufficient and are better off by being away from the pack they would be happy if their privacy is appreciated by their colleagues and peers.
They are self loving: As they have handled their situations and challenges all by themselves. This also makes them optimistic in their thoughts which leads to continues improvement in their skills and work. Of all the personalities this quality stands out and makes the individual unique.
They are in touch with their feelings: They have a strong emotional balance as they are keen in observing they also try to understand the caused that trigger the negative thoughts and emotions in them. This helps them to become more confident about themselves helps them break through the limits they have set for themselves which also makes them very challenging and competitive.
They set clear boundaries: As they are noted to be people who respect privacy they are good in setting boundaries. They are able to understand themselves and have a strong value system in practice. They are respect the boundaries of others and might turn a bit reckless if their boundaries are crossed. This nature of poss a great challenge to the management in handling these personalities as the boundaries vary from individual to individual. This character also limits the lone wolf from actively participating in a team.
They are thought provoking: Lone wolf are fans of long and meaning full conversation. They are not much inclined towards shallow and trivial conversations. They are passionate individuals and open up when questioned on topics of their interest.
Chapter 2: To identify the reasons for being a lone wolf
The individual could develop themselves to be a lone wolf as a result of various personality they possess and their real life situations that that have come across in their past. Few major personalities which could cause an individual to be a lone wolf are discussed below. One or more of the below personalities can have an influence in evolution of an individual as a lone wolf.
Introversion: Individuals who are introverts tend to put themselves together in solitude and are easily exhausted when they are admits of a crowd. This personality tends to keep the individual away from engaging them selves much with groups. This does not mean that lone wolf individuals are anti-social, they do not require much affiliation with other individuals.
Creative: Individuals who are referred as loners are often found to be creative and tend to be good in arts like painting, writing, poetry, music etc. Most of these arts require high level of concentration and requires practice in solitude. Lone wolf individuals tend to be withdrawn and during this phase the then to be keen on observing their surroundings and notice things which are generally over looked by others.
Insecurity: Individuals who feel insured of being judged by their peers and colleagues. Loners tend to avoid social gathering and appear to be reserved to their self and avoid working in groups.
Privacy: Loners tend to give a great deal of importance to their privacy. They tend to stay away from the lime light as they find it exhausting to be a part of any crowd. This leads them to develop self reliance and self love this can also make the individual set clear boundaries around them.
Chapter 3: Ways to effectively manage lone wolf employees
Managing a lone wolf employee could be challenging in a team, the performance of the entire team suffers if one person is not chipping in. It is not effective to involve a lone wolf to participate in the team by insisting on team work and portraying the importance of team.
Avoiding prejudice: As lone wolves are more focused and less distracted they tend to be more efficient in their deliverable. Hence, it will not be advisable to the leader or the manager to be carry a prejudice that individuals who separate themselves are less interesting in accomplishing team goals because that person could be a major contributor or who accepts takes responsibility for their quality of work.
Avoid being biased: The management should focus on work capability and not on work preferences. The management should understand that a loner is not incapable of collaborating with the team or leading a task or a project. The work and opportunities should be allocated based on the skill and track record of the employees and not based on this personality trait alone.
Micromanagement is not the key: Loners are high spirited individuals are are highly motivated and focused on accomplish their tasks. Management should understand this trait and should allow the employees to work in their own space and not having constant follow up as this act of micro management might back fire the management.
This does not mean that the loners should not be questioned the management should organize periodic review of the task allocated to them and it is not encouraged to chase them on a day to day basis.
Forced collaboration is not effective: One cannot deny the importance collaboration in this present times especially with respect to MNCs. Lone employees might not find comfortable to attend meetings and gathering which do not offer any real value. The management should scrutinize the collaborations in work place and try to cut down on unnecessary collaboration which do not provide any positive outcome to the organization. It can be observed that if loners are forced to collaborate they generally tend to be willing to step back behind their team.
Actions to be based on the whole picture: It can be identified that if the loner is not falling in accordance with the team the whole team might suffer or go through a disturbance. At this moment the management should handle the situation based on the bigger picture of the entire team and not be carried away by the acts of the loner. The management can seek the inputs from all the team members and get to implement a strategy by taking into the perspective of the team as a whole in order to restore the balance in the team.
Nurture of collaboration: Interacting with fellow colleagues is the minimum requirement for any job. As loners find it difficult to get along a group they should be assisted to develop the skill of collaboration at least to an extent to manage the collaborate when the situation demands it. The management can alter the reward policies to promote the loner to be more collaborative. They can have training, mentor ship program to aid the loner to be more active in a team. More to all this the loner should be appreciated for stepping out of their comfort zone as that will encourage them to become more of a team player.
Set limits for freedom: At times it is acceptable for the management to blame an employee for their lone wolf behavior. The management should draw a line to restrict the misuse of the freedom given to the lone wolf. As it is the nature if the lone wolf employees to be reckless and tend to break the organization’s code of conduct, in such instances the management can warn the employees of their acts and take disciplinary actions and can even fire them if required.
Conclusion:
All individuals in an organization should accept that there is a bit of aggression in every individual and there is also a touch of gentleness in every person. There is need for a bit of aggression at times to keep the project or the team in track. Every employee should understand the combination of aggression and gentleness in their peer employees for better collaboration of the team. Ever loners should try to develop an open mind to accept their peers as it is not always possible to play as a loner when the situation demands a team effort. Management should assist the lone wolf employees to develop their collaborative skills at to an extent to which it benefits the organization.
It is better for an employee to be a team player and lone wolf as it helps them to be more flexible and work more efficiently and have high morale.
The grown of investments in securities has led to higher risk and return on the investments. This paper aims at identifying the risks that are involved in the securities markets and the tools to measure the risk. The various types of returns and their relationship with each other are also discussed. The paper brings out the advantages of diversification of investments and applies the CAPM theory to the construction of an efficient portfolio. This study also involves identifying the uses and application of Capital Market Line (CML) and Efficient Portfolio curves. This paper also includes the valuation of a portfolio using the Sharpe ratio.
Keywords: Security analysis, Capital Asset Pricing Model, Capital Market Line (CML), Efficient frontier, Risk and Return, Sharpe ratio.
1.0 Introduction
“Never depend on single income. Make investment to create a second source.”- Warren Buffett.The growth of inflation and the reduction in the returns on the traditional investments has led to an increase in the investment in other forms of investments ranging from Real Estate, EFTs, Securities, And Precious metals etc. As a result if this the increase in the risk involved in investment has also significantly grown up as the returns from these investments is dependent on various factors. The returns on the modern avenues of investments like Mutual funds, ETF, Securities are not fixed like in case of Bank and post office deposits or Bonds or any debit instrument whose return is already fixed at the time of purchase of that instrument. With the inclusion of FDI and FII in the Indian Stock market the value of stocks have increased due to large demand by FDI and FII. There is a strong positive correlation between FDI & Sensex and FDI & nifty and moderate positive correlation between FII & Sensex and FII. The major drawback of investing in securities is the risk involved as the returns are not fixed. In this study the researcher has described the classification of risks and the different type of returns often discussed in securities analysis.
This paper also brings out the application of the Capital Asset Pricing Model (CAPM) in construction of an efficient portfolio with the help of SML, CML and Efficient Frontier.
CAPM was first developed by William F Sharpe, Jan Mossing and John Linter based on the modern portfolio theory given by Harry Markowitz in 1952. This paper is limited to investigation of the simple CAPM involving single period, risks and beta only. The other limitation of this study is it does not provide an insight on the business risks worldwide. It should also be noted that all the securities studied are from a single market, India and are traded over a single stock exchange (BSE). Sensex is takes as the market indicator as it shows as the movement of most of the stocks traded in the BSE. Also as this study is based on the CAPM which was developed in the late 1960s with assumptions specific to that period but the current market is different from the history the assumptions will be later discussed in this paper.
2.0 Review of literature:
Gupta (2011) conducted a comparative study of various Asian stock markets with the Indian Stock market. The Study was to identify the correlation of the returns of Indian stock market with respect to other selected stock exchanges in Asia. The study included BSE (India), KS11 (Korea), Hang Sang (Hong Kong), KLSE (Malaysia), JKS (Indonesia). The Study identified that the weekly return of Indian market and the Indonesian market was the highest at 23% and the Indian Stock market had the highest volatility indicating higher level of risk. This study was conducted in during the period between 2005 and 2009.
Do, Toan Trung (2014) in this study states that the investors prefer investment than savings to create another source of income in addition to the income they earn by working. The study states that the investor should be aware of their risk tolerance limits and the characteristics of the assets in which they invest.
Dinesh Dayani (2017) this article lists down the top ten biggest stock exchanges in the world as of November 2017. Bombay Stock Exchange (BSE), India was ranked the 10th biggest stock exchange in the world with a market capitalization of Rs1,43,82,306 Crores (US$2.22 trillion). The article also states that BSE500 has grown from 11,072.57 points to 14,494.19 points and this indicates a rough growth of 30.9% in the year 2017.
Rakesh Kumar and Raj S Dhankar (2008) Study the relationship between risk and return and also examine diversification effect on portfolio risk, which included market and non-market risk. The study was carried out daily, weekly and monthly on the basis of adjusted opening and closing prices of BSE 100 composite portfolios during the period June1996 to May 2005. The study states that Portfolio risk and return display a high degree of positive correlation in terms of Monthly returns. It is also identified that non-market risk in the portfolio tends to decline with the diversification in the portfolio.
3.0 Objectives of the study:
To identify the risks and return in security investment
To understand the various tools of measuring risk
To understand Capital Asset Pricing Model and related concepts
Valuation of portfolio using Sharpe Ratio
Application of CAPM in portfolio construction
4.0 Research Methodology:
This paper is constructed based with the aim of constructing the optimal portfolio according to the risk level of the investors through the application of CAPM theory. This study is carried out on deductive and inductive methods. Deductive method was used to portray the different types of risks and returns in investments and on understand the advantages of portfolio diversification and CAPM theory and related concepts. Inductive method of study was used with the formulation on new hypothesis to study the effectiveness of the portfolio diversification in real life scenario and to test the effect of the constructing a portfolio based on CAPM and related tools.
The descriptive statistics was carried out by feeding the relevant data about the stock in Excel for the calculation of correlation among the securities. Other measures of risk were calculated by applying the related formulas. The efficient frontier, CML and SML were constructed using excel by adding relevant data about the securities.
5.0 RISK AND RETURN
In this chapter the researcher deals with the two major classification of Risk in securities market and elongates on the return concept which will be used in the CAPM model.
Every investor should be aware of the risk that is involved in the investments before investing. This is the fundamentals of the CAPM model as this model deals with risk free return, beta of a security and market return these concepts will be discussed in detail in the coming chapters.
5.1 Risk
There are different types of risk like business, finance, international risk etc. However with respect to the security investment the risks are classified into two risks a. System or market risk b. Unsystematic or unique risk.
5.1.1 System or Market risk:
This risk is common to the whole market and it impacts the flow and return of the market as a whole. Interest rate, Tax structure, Monetary and Fiscal policy and political stability can be quoted as examples for System or market risk.
System risk is also called as “non-diversifiable risk” or “volatility” as this category of risk is common to a major number of securities traded in a single market. To counter these risks the investor could hold a significant investments in fixed return securities which will respond differently to a major systematic change. For example: An increase in interest rates will increase the returns on the new bonds but will lead to reduction in the price of stock as the borrowing cost increases and also the return demanded of equity will increase as the risk free rate of return (discussed in later chapter) will be high. This type of risk cannot be completely eliminated through diversification alone.
The BSE Sensex fell 24.6% towards the close of 2011 an article by B. S Srinivasalu Reddy in India today mentions that this fall is primarily due to high inflation, increase in interest rates, and fall in domestic growth, depreciation local currency and other global instability in the past 12 months. This incident shows that the market risk is applicable to majority of the securities in the market.
5.1.2 Unsystematic or specific risk:
Unsystematic or specific risk is the risk associated with a particular security or investment. These risks are micro economic in nature and are related to a single asset. This risk arises due to the operational or financial risk involved in a specific company. Risks like labor strike, poor management decisions, and increase in the cost of inputs can be classified under specific risk. Apart from operational risk it also systematic risk includes financial risk like improper capital structure and poor financing decisions.
This risk is also called as diversifiable risk as this risk can be reduced by investing in different securities or multiple industries and companies. Specific risk can be reduced by constructing a portfolio where the investments are uncorrelated in terms of returns. The table given below shows the advantage of diversification for an investor.
Number of securities
Reduction in specific risks (%)
1
0
2
46
4
72
8
81
16
93
32
96
64
98
500
99
Table 1: Effect of diversification on specific risk
*Table 1-Source: Pike, R., & Neale, B. (2009). Corporate Finance and Investment: Decisions and Strategies (6th Ed.). Pearson. 231
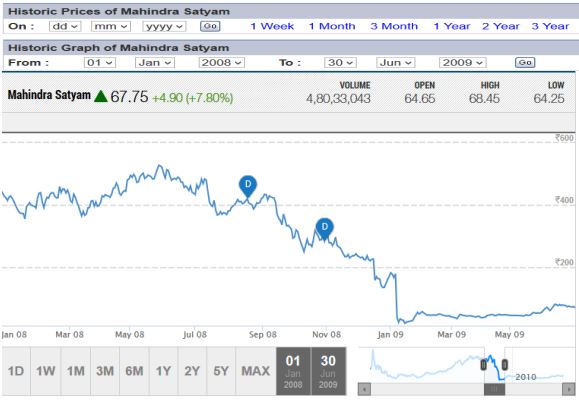
The incident of crash of Satyam stock values after the founder and chairman of the company Ramalinga Raju confessed on 9th January 2009 that the company’s accounts were tampered and brought to light the Rs 7,136-Crore fraud carried out by him and closed circle of relatives and employees. The stock of Satyam computes fell to Rs 11:50 on Friday, the stock of the said company was traded for a high of Rs 544:00 last year (2008).
Return can be described as the reward for the risk the investors takes by investing in a security. With greater degree of risk the investors demand greater returns from an investment. The risk-return trade off states that the potential return rises with an increase in risk. It can observed that the major composition of the risk involved in investing in a security is the result of the volatility of the market or the systematic risk as the specific risk or unsystematic can be reduced to a large extent by diversifying the investment into different portfolios.
In this study the researcher has studied a. Risk free rate of return b. Market return and premium c. Expected return d. Actual return e. Required return
5.2.1 Risk free rate of return:
Theoretically risk free return can be defined as the return investors earn with zero risk. But practically in the globalized word of today no investment can be classified as risk free investment as even the safest of investment carry a small amount of risk and the return on these safest investments are also significantly low. Generally the securities backed by the Government are classified as risk free security and the return fixed on these securities are considered risk free rate of return. As specified that all investment involve a small amount of risk, investment in Government securities is backed by the Government so the risk of the investment depends on the credibility of the Government backing the securities.
In the year 2003 in Uruguay the Government extended the average maturity on bonds with no reduction of principle as a debit exchange as the Uruguay debt escalated to 100% of GDP. Moddy’s classified this offer as a distressed exchange/default.
For this study the interest rate on 364-Day Treasury bill (Primary) Yield of the India Government at the rate of 7.68% is considered to be risk free investment therefore the risk free rate for this study is 7.68% per annum.
5.2.2.1 Expected return:
The return an investor expects or anticipates from a portfolio on the basis the past information available about a stock. It can be calculated using computers or processed based on the information the investor receives. Expected return on a portfolio is calculated using the formula
Re = R1P1 + R2P2 + R3P3………RnPn
Re -Expected return
Rn -Return on investment “n”
Pn – Probability of the return on investment “n”
Expected return acts like a projection or an estimate of the portfolio return in the future and hence the chance of difference between the actual return and expected return can be high, it is not advisable for an investor to make a decision based on the expected return of an asset as in calculation if expected return does not incorporate the deviation of the returns over the period of time, which is a major risk component.
5.2.2.1 Expected return on a portfolio:
The return an investor expects from a portfolio consisting of more than one asset can be calculated as the weighted average of the anticipated future profits of the each asset in the portfolio. Formula for computation of expected return on a portfolio is as below.
Ep = w1R1 + w2R2 + …+ wnRn
Ep = Expected return on a portfolio
w1 = Weight or portion of asset one
R1 = Expected return on asset 1
Expected return on a portfolio does not guarantee the rate of return. It can be used as a factor in analyzing the Coefficient Variation (CV) of the portfolio.
5.2.3 Actual return:
It is the measure of the actual return the portfolio has earned over a period of time. Actual return is calculated using the formula
Ra =[(P1-P0) + D]/P0
Ra =Actual return
P1 = Value of investment at the end of the period
P0 = Value of investment at the beginning of the period
D = Dividend earned during the period (if any)
Actual return is calculated toward the end of the period as is used to identify the deviation of the return from the portfolio compared to other returns; this helps the investor to analyze the performance of the portfolio for the specified period.
5.2.4 Required return:
Required rate of return is the minimum return an investment is required to earn for an investor to invest. It can also be said that required return is the minimum return the investor demands to invest in a particular investment. CAPM can be applied to identify the required return of an investment. Required return is calculated using various factors including β (Beta) of a security, rate of inflation, risk free return and market return. This is further explained along with CAPM model in chapter 3.
6.0 MEASURES OF RISK:
Standard deviation is the tool that of often used by investors to analyze the involved in investing in an asset. Standard deviation is also referred as the volatility of the return on the asset. If an asset has high standard deviation then it is referred as a highly volatile stock i.e. the variation between the average return and actual return over the past years has been high. These assets are classified as high risk assets as it is difficult to project the future return of the asset due to its high volatile nature.
6.1 Variance and Standard deviation (Ϭ) of a portfolio:
Standard deviation is the measure of dispersion of a data from its mean. Calculation of the Standard deviation of the return of any asset will help in identifying the volatility or the risk involved in the investment. The formula to calculate a standard deviation of a single random variable can be applied to calculate the standard deviation of a single asset portfolio.
Ϭ = [(Ri – Re)2 Pi]0.5
Ϭ = Standard deviation of the asset
Ri = Actual rate of return
Re = Expected rate of return
Pi = Probability of actual return
Example:
Asset XYZ has an expected return of 10% and the actual returns for the past the years were 8%, 12% and 15% with a probability of 0.4, 0.3 and 0.3 respectively. The Standard deviation of the asset can be calculated as follows
The above illustration explains that the investor can expect a deviation of +3.21% between the actual deviation and expected deviation.
Using the standard deviation the investor will be able to ascertain the volatility or the level of risk in an investment. Risk averse investors will prefer investing in low volatile securities or securities with less standard deviation. Hence, the standard deviation is also helpful in comparison of two or more assets based on the volatility.
6.2 Coefficient of variation (CV):
Another popular tool to measure the risk of an asset is Coefficient of variation. CV gives the ratio of the risk (Ϭ) as a part of expected return (Re). CV is highly helpful in comparison of two or more asset and is relatively easy provided the investor is aware of the Re and the Ϭ of the asset. CV of an asset is calculated using the formula
CV = Ϭ/Re
CV= Coefficient of variation
Ϭ = Standard deviation of the asset
Re = Expected rate of return
If two assets A and B yield the same rate of return and asset A has a higher CV than asset B it indicates that the investor is taking more risk by investing in asset A compared to asset B as asset B gives the same return for a lesser risk.
6.3 Standard deviation of portfolio with two or more assets:
The return on a portfolio can be calculated as the sum of the product of the weights or portion of each asset in the portfolio to the respective return of each asset. This same concept cannot be applied while calculating the portfolio standard deviation. The calculation of portfolio standard deviation includes the covariance abound the different assets in the portfolio. If the assets are perfectly correlated i.e. correlation between the assets is 1 then a simple weighted average of the variance will work. But in most cases it very rare to have assets with a correlation of 1. Hence, we take into account the covariance of the assets into the equation.
6.3.1 Covariance measures how the assets move together in the market. The assets could have positive covariance (move in the same direction) or negative covariance (move in the opposite direction). By applying the covariance of the assets the investor will be able to compute the Correlation Coefficient among the assets. Covariance (Cov) of the assets can be computed using the below formula.
Covij= Ʃ [(Ri – Average return on (i)) * (Rj – Average return on (j))] /n-1
Covij= Covariance of the assets i and j
Ri = Return on asset i
Rj = Return on asset j
n = Total number of samples
6.3.2 Correlation Coefficient:
The calculation of covariance between two stocks shows the direction in which each stock move respect to the other stock. The major limitation about the covariance is that, it helps the investor to identify the direction of asset movement with respect to the other asset but do not specify the strength of the relationship. In order to reduce the specific risk or unique risk or for an effective application of diversification of the portfolio the investor should holds assets which are negatively correlated i.e. move in opposite direction. Though, covariance helps in identifying the direction of change Correlation Coefficient assists in analyzing the strength of the relationship. Therefore, Correlation should be used along with covariance to determine the strength of the relationship. Correlation Coefficient is calculated as follows.
Correlation (i, j) = ρij = Covij / Ϭi * Ϭj Covij = Covariance of the assets i and j
Ϭi = Standard deviation of asset i
Ϭj = Standard deviation of asset j
6.3.2 Standard deviation of a portfolio:
The standard deviation of a portfolio with more than one asset depends on the standard deviation of each asset, the proportion of each asset in the portfolio, the covariance of the assets. Standard deviation of the portfolio is given calculated by applying the below formula.
Ϭp = (Wi2Ϭi2 + Wj2Ϭj2+ 2*Wi*Wj*Covij)0.5
Ϭp = Standard deviation of the portfolio
Wi2 = Proportion of asset i (squared)
Ϭi2 = Standard deviation of the asset i (squared)
Wj2 = Proportion of asset j (squared)
Ϭj2 = Standard deviation of the asset j (squared)
Wi= Proportion of asset i
Wj = Proportion of asset j
Covij = Covariance of assets i and j
Illustration:
The researcher has chosen two securities a. Maruti Suzuki India (MARUTI) and b. Tata Consultancy Services (TCS). Information about the stock is as below.
Table 2 – Portfolio of two securities and their measures of risk
Secuities
MARUTI (i)
TCS (j)
Standard deviation
1.15%
0.839%
Weight of the security
0.5
0.5
Covariance
0.0002
Correlation Coefficient
0.0367
*Data for covariance collected from “Top stock research”.Calculations in appendix
Standard deviation of the portfolio:
Ϭp = (Wi2Ϭi2 + Wj2Ϭj2+ 2*Wi*Wj*Covij)0.5
= [(0.5)2(0.0115)2 + (0.5)2(0.008369)2 + 2*0.5*0.5*0.0002)0.5 = 0.012 or 1.2%
Expected return on the portfolio, Re= 0.19% + 2.27% = 2.46%
CV = Ϭ/Re = 1.2/2.46 = 0.4878
From the above calculations it can be interpreted that the risk involved in the portfolio is 1.2% and the expected return is 2.46%. The Correlation Coefficient is 0.0367 and the Covariance is 0.0002. The covariance shows that the assets move in the same direction but on examining the Correlation Coefficient it can be identified that the relationship between these two assets is very weak hence diversification of the investment in these two assets will lead to reduction and risk and provides the investor with the benefits of diversification.
7.0CAPITAL ASSET PRICING MODEL (CAPM)
The CAPM guides the investor in constructing a portfolio. By applying CAPM and the related concepts the investor will be able to know the maximum return at a specified level of risk or the minimum risk one should take to earn a said rate of return. CAPM was developed after 12 years from the development of the Portfolio diversification model developed by Harry Markowitz in 1952. This model helps the investor to decide on the how to apply the concept of diversification i.e to select the best mix of different assets in a portfolio. In order to understand the model the investor must be aware of the underlying concepts in CAPM. In this paper the researcher discusses on a. Marker return and Market risk premium (Rm) b. Beta of the stock (β) c. Expected return on an asset (Re) d. Efficient Frontier e. Capital Market Line (CML)
7.1 Market Return (Rm) and Market Premium:
Market portfolio consists of the entire stock that is available to the investor, it is the aggregate of all the securities or investment avenues available in the entire economy. The return expected by an investor from the market portfolio is Market return. As the specific risk can be eliminated to a large extent by implementing diversification technique and selecting the right combination of assets the return of an asset is the greatly influenced by the Market risk or Systematic risk. Market return is generally calculated on the index of stock markets as they show a broader picture of the market trend. S&P 500 is a popular index that is used by analysts to study the past returns in a market and project the future. The market return will differ from one investor to the other based on the index they use for analysis and the investors expectation from the market. The market return for this study is calculated on the basis of BSE Sensex which is composed of the 30 most actively traded stocks in BSE. Sensex is composed of 30 of the largest and most actively-traded stocks on the BSE, providing an accurate gauge of India’s economy. The return on the market was considered to be 15.2% annually.
7.1.1 Market premium is the excess of return the market portfolio delivers over the risk free return. In other words it can be defined as the excess of return investors receives over the risk free rate of return by investing the money in the market over risk free securities. Market premium or risk premium is an important factor to be employed in application of CAPM model. Formula for calculation of Market premium (MP).
MP = Rm-Rf
MP = Market premium
Rm = Market return
Rf = Risk free return
7.2 Beta of the stock (β):
It measures the relation between of a particular asset and the market portfolio. It is a measure of volatility, or systematic risk of an asset. The beta of a stock measures the extent to which returns on a stack and the market move together. The Beta of a stock can be interpreted as follows. If the Beta of a stock is 1, it shows that the asset moves perfectly along the market with no deviation. A beta value of less than one can be interpreted as, the volatility of the stock is less than the volatility in the market and a beta value of more than one shows that the stock is more volatile than the market.
Example: If a company is said to have a beta of 1.5 the investors in this company can expect a return of 150% of market return i.e. if the market return is 12% the investor can expect 18% (12* 150/100) from this company. It also indicates that if the market is falling the investor in this company will lose 150% of the market i.e. If the market has a return of -6% the investor in this company will expect -9% [(-6)*150/100]. If a company is said to have a beta of 0.65 the investor in this company can expect a 65% of the market return. A higher beta shows that the stock will bring higher return than the market but it also has a higher magnitude of loss if the market falls.
Beta of a security can be calculated using the below formula
β = Cov(i,m)/(Ϭm)2
β =Beta of the security
Cov(i,m) = Covariance of the security and the market
(Ϭm)2 = Variance of market
7.3 Expected return on an asset (Re):
CAPM model guides the investor to decide on the optimal portfolio which is expected to earn a specific rate of return with minimum risk. The expected return on an asset is the return the investor is expected to earn from the asset in the future. The formula to calculate the expected rate of return on an asset is as follows.
Re = Rf + β(Rm- Rf)
Re = Expected return on an asset
Rf = Risk free rate of return
β = Beta of the asset
Rm= Expected return on the market
From the formula it can be identified that the expected rate of return on an asset is the sum of the risk free rate (Rf) and the product of the asset’s volatility compared with the market (β) and the addition risk the investor accepts by investing in the market over the risk free assets i.e. Market premium (Rm- Rf).
7.4 Efficient Frontier:
In the process of construction of a portfolio using multiple assets the investor will have plenty of was to combine the different assets or to allocate the capital which is a limited resource among different asset. The allocation of capital depends significantly in the risk tolerance level of the investor. A risk averse investor will prefer to have more of assets with low level of volatility. The efficient portfolio is the combination which will yield the highest return for a specified rate of risk. For every level of risk there exists an efficient portfolio which will give the highest return at that specific level of risk.
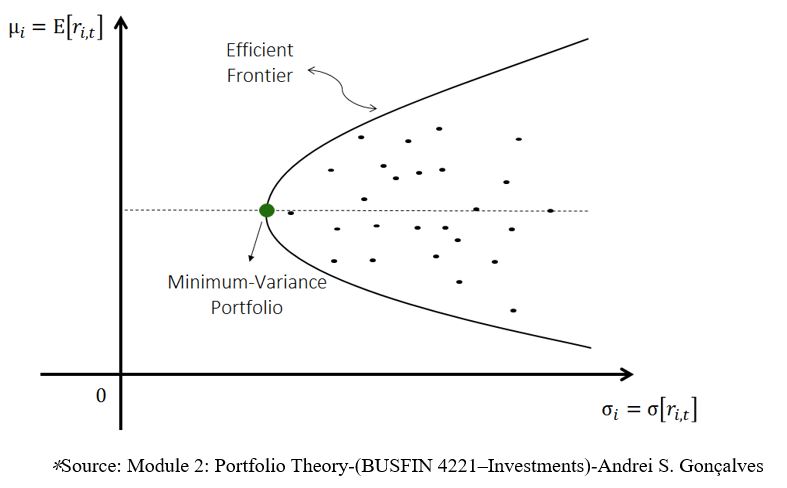
Figure 2 Optimal portfolio:
In the Figure 2, the graph shows the various combination of assets an investor can hold and the assets or portfolios are plotted by taking the risk (Ϭ) involved in the portfolio along the X-axis and the expected return (Re) on Y-axis. On the graph the point where the risk is minimum for the different combination of the asset is called the Minimum variance portfolio.It is also called as the minimum risk portfolio and also represents the best diversification possible as it reduces the risk as low as possible. As we plot all the portfolios which yield the maximum return at a specified level of risk to the right of the minimum variance portfolio we see the efficient frontier as shown in the figure. At a given level of risk the maximum return an investor can expect falls on the efficient frontier, at least when short selling is allowed. All the assets and combination of assets which fall below the efficient frontier are considered to be sub-optimal as there is an optimal combination which falls on the efficient frontier. Therefore, every portfolio that appears on the efficient frontier is called Optimal Portfolio as they show the highest expected return for a specific level of risk given by the investor.
7.5 Capital Market Line (CML)
The different combination of risky assets which gives the highest return at a specific level of risk can be identified using the efficient frontier. The efficient frontier consider only the risky assets but in real word the investor can also invest in risk free securities like Treasure Bills which are not included in construction of an efficient frontier as these assets are classified as risk free asset as they are backed by the Government. In order to include the risk free assets in construction of a portfolio the investor is guided by the Capital Allocation Line (CAL) and Capital Market Line (CML). Theoretically CALs consists of all possible combination of risky and risk free assets for different levels of expected returns of an investor. The slope of the CAL is constructed using the formula
ERp = Rf + [(ERp – Rf)/Ϭp] *Ϭnp
ERp = Expected return on the portfolio
Rf = Risk free rate of return
Rm = Expected return on the combined risky assets
Ϭnp = Standard deviation of the new portfolio (including risk-free assets)
Ϭp = Standard deviation of the combined risky assets
7.5.1 Relationship between Capital allocation line (CAL) and Efficient frontier:
For every combination of risky assets a capital allocation line can be constructed and the slope of the line is influenced by the excess return the portfolio gives over the risk free return and the risk involved in the combinations.
Figure 2:
* Source: Figure 7.13 Capital allocation lines with various portfolios from the efficient set. (Investments- Bodie, Kane and Marcus
In the above figure it can be observed that there three CAL i.e CAL (G) for Portfolio G, CAL (A) for Portfolio A and CAL (P) for Portfolio P. CAL (P) is the steepest of the three lines and has the highest slop of the three which indicated that the portfolio on this line is the most optimal combination of risky and risk free asset of the whole frontier i.e. At this combination the investor is expected to earn the highest with a relatively low return. It can also be narrated that at Portfolio P the risk return trade-off is the best as CAL represents the risk return trade-off of a portfolio and every other CAL will remain below the CAL (P). CAL (P) which offers the highest risk return tradeoff is referred as the Capital Market Line (CML).Portfolio P is also called the Tangency portfolio or Mean Variance Efficient portfolio (MVE).
8.0: VALUATION OF PORTFOLIO USING SHARPE RATIO
The Sharpe Ratio was developed by Nobel laureate William F. Sharpe. Sharpe ratio give the excess return the portfolio offers over the risk free rate for every unit of risk taken by the investor. A portfolio higher with a higher Sharpe ratio indicates that the portfolio return as better return for the risk as compared with a portfolio with the lesser Sharpe ratio. The slope of the CML is the highest Sharpe ratio possible because at the combination of the portfolio which falls on the CML i.e. Tangency Portfolio offer the best risk return trade off to the investor. The Sharpe ratio is calculated using the formula
Sp =(ERp – Rf) / Ϭp
Sp = Sharpe ratio
Rf = Risk free rate of return
Rm = Expected return on the combined risky assets
Ϭp = Standard deviation of the combined risky assets
9.0 CONSTRUCTION OF COMPLETE OPTIMAL PORTFOLO
For the purpose of this study the researcher has chosen three assets which are traded in Bombay Stock Exchange (BSE). The monthly returns on these securities for the past year since Sept 2017 to Aug 2018 was used to construct the portfolio.
9.1 Steps in construction of a complete optimal portfolio:
Step 1: As a first step the researcher constructed an efficient frontier which demonstrates the risk and return for different combination of the three securities
Step 2: In this step the researcher identified the slop of the CML i.e. the combination having the highest Shape ratio
Step 3: Post the identification of the portfolio with the highest Sharpe ratio, CAL which is corresponding to that portfolio was constructed using Excel. This CAL is also the CML as this has the highest slope or Sharpe ratio compared to other combinations.
Step 4: To decide on the proportion to be invested in risky asset the below formula is applied
y = (ERp – Rf)/A*Ϭp
y= Proportion to be invested in risky assets
ERp = Expected return on the portfolio
Rf = Risk free rate of return
Ϭp = Standard deviation of the combined risky assets
A = Risk aversion of the investor. It is usually measured in a scale of 1 to 5 with 1 being highly averse to risk and 5 being less risk averse. A person who is neutral to risk will have a risk aversion value of 0
Step 5: Once the proportion of risky assets is decided the remaining amount to be invested in risk free security is identified by subtracting it from the entire fund available for investment
Step 6: This is the last step where the investor will apportion the amount kept allocated for risky assets in proportion to the optimal portfolio identified and the remaining in the risk free asset
9.2 Construction of optimal portfolio among the chosen securities:
Table 3 –Correlation of securities
HDFC
Sun Pharma
Coal India
HDFC
1.0000
-0.3594
0.1180
Sun Pharma
-0.3594
1.0000
0.0416
Coal India
0.1180
0.0416
1.0000
* Source of data and calculation attached in appendix
Table 4 – Covariance of securities
HDFC
Sun Pharma
Coal India
HDFC
0.0019
-0.0013
0.0004
Sun Pharma
-0.0013
0.0068
0.0003
Coal India
0.0004
0.0003
0.0058
*Source of data and calculation attached in appendix
From the above calculations it can be interpreted that the three securities will be able to provide the investor with the benefits of diversification as the correlation among these securities are considerably less ranging from -0.3594 and 0.1180.
Chart 1: Identification of Efficient frontier and CML
*Source: Developed by author. Data in appendix
Chart 2 Tangency portfolio:
*Source: Chart 1
Table 5: Tangential portfolio
HDFC
Sun Pharma
Coal India
Risk
Expected return
CML
Sharpe ratio
53.82%
33.36%
12.82%
3.169%
1.244%
1.244%
0.19059
* Source Developed by author, data in appendix
From the analysis it is identified that the above portfolio has the highest Sharpe ratio of all the combination and from the chart it can also be identified that the CAL respective to this portfolio is tangential to the frontier hence it is the CML of the frontier. Therefore it can be said that the above portfolio is the optimal portfolio for the combination of these securities.
9.3 Complete optimal portfolio of the case:
If the investor has a risk aversion value of 4 the complete optimal portfolio at this point is calculated as below.
9.3.1 Calculation of proportion of amount to be invested in risky assets:
y = (ERp – Rf)/A*Ϭp
ERp = 1.244%
Rf = 0.64%
Ϭp = 3.169%
A = 4
y = 47.85%
Therefore in the complete optimal portfolio the investor holds 47.85% of funds in risk free assets and 52.15% of funds in risky assets. The portfolio constructed will appear as follows.
Table 6: Completely optimal portfolio
HDFC
Sun Pharma
Coal India
Risk free
Expected return
Portfolio risk
Sharpe ratio
28.07%
17.04%
6.69%
47.85%
1.29%
1.630%
0.39518
*Source: Developed by author
It can be observed that with the addition of risk free asset to the portfolio the investor is able to enjoy a better risk return tradeoff. The inclusion of risk free assets reduces the risk by a significant level and it is reflected by increase in Sharpe ratio. It can be noted that the Sharpe ratio of optimal complete portfolio is greater than the optimal portfolio with risky assets alone.
Table 7 – Observation of Completely optimal portfolio from 01.09.2018 to 21.09.2018
Particulars
HDFC
Sun Pharma
Coal India
Risk free
Closing 21st Sept
1,970.25
634.90
275.25
Opening 1st Sept
2,062.25
652.20
286.10
Portion of investment
28.07%
17.04%
6.69%
48.20%
Investment in (Rs)
28,070.00
17,040.00
6,690.00
48,200.00
No. of stock
13
25
22
Value of investment (opening)
26,809.25
16,305.00
6,294.20
Value of investment (Closing)
25,613.25
15,872.50
6,055.50
Loss on investment
1,196.00
432.50
238.70
Gain on Investment
215.94
Net Loss on portfolio
1,651.26
*Source: Developed by author. Opening and closing balances of securities collected from economictimes.indiatimes.com
Table 8 – Observation of Portfolio without diversification from 01.09.2018 to 21.09.2018
Particulars
HDFC
Sun Pharma
Coal India
Closing 21st Sept
1,970.25
634.90
275.25
Opening 1st Sept
2,062.25
652.20
286.10
Portion of investment
100.00%
100.00%
100.00%
Investment in (Rs)
100,000.00
100,000.00
100,000.00
No. of stock
48
153
350
Value of investment (opening)
100,000.00
100,000.00
100,000.00
Value of investment (Closing)
95,538.85
97,347.44
96,207.62
Loss on investment
4,461.15
2,652.56
3,792.38
* Source: Developed by author. Opening and closing balances of securities collected from economictimes.indiatimes.com
On comparing the table 7 and 8 the researcher was able to see that the loss on the completely optimal portfolio is considerably less compared to a single asset portfolio. Hence, it can concluded that the CAMP model holds good with respect to the securities included in the study traded in BSE for the period 1st Sept 2018 to 21st Sept 2018.
10.0 Assumptions and limitations of the study:
This study was conducted based on the assumptions of the CAPM model and certain assumption of CAPM that has strong limitation in this study are
All investors are rational and expect maximum with minimum risk – Not all investors fall under this category as the market is greatly influenced by speculators
The securities can be traded in fractions for any amount – This assumption is not always true as securities can be traded in fractions
In reality every investment included a small amount of risk hence practically there is no risk free investment
This study assumes that there is no tax rate or transaction cost but this assumption is far from reality as taxes are applicable on the returns from investment and different level of taxes apply depending on the nature of return. The investor has to pay brokerage and transaction fee for carrying trading in securities.
10.1 Other limitations:
This study was limited to three securities from the same market (BSE)
This study does not practically test the efficiency of the results with a real life market situation over a longer period of time
The calculations in this study are based on past 12 months only hence it does not provide a long term trend of the securities
Monthly returns on the securities was considered as the basis for calculation, monthly returns do not provide the actual trend in the value of securities
11.0 Findings of the study:
Risks involved in investments are broadly classified into systematic risk and unsystematic or specific.
Specific risks involved in an investment can be reduced significantly by diversifying the investments among different investment avenues
The standard deviation of returns from an investment is primarily considered as a measure if risk of the investment
In order to maximize the advantage of diversification the investor should hold securities that are less correlated among each other
All portfolios that lay on the efficient frontier are superior to the portfolios that appear below the efficient frontier
The CAL that is tangential to the efficient frontier carries the highest slope and is called as CML
Portfolio corresponding to the CML is identified to be the best portfolio mix as at this point the Sharpe ratio is maximum
Sharpe ratios shows the risk return tradeoff of the portfolio. Higher Sharpe ratio of a portfolio shows that the investor is able to get more return for the risk involved compared to a portfolio with low Sharpe ratio
To construct a complete optimal portfolio which included risk free assets the investor’s risk aversion value is considered
A complete optimal portfolio has a better Sharpe ratio as the risk is reduced due to a part of investment being made in risk free assets
12.0 Conclusion:
CAPM was an important theory developed over the portfolio diversification. Though this theory has its limitations bases on its assumption it is still a very popular tool used by investors and analysts in construction of a portfolio. From this study we can understand that the investor can maximize the return and minimize the risk by practicing the concept of diversification. From this study we see that the expected return on a portfolio depends on the risk of the portfolio and the risks aversion of the investor. This model helps the investor to construct a portfolio but does not guarantee the actual return as the return is determined by the investors psychology and the performance of the company, industry and the economy. In the present times of globalize economic it makes it even more difficult for the investors and analysts in construction and management of a portfolio due to the wide range of investment avenues. Each investment avenue needs to be thoroughly studied before the investment is made. Globalization has also increased the complexity of measuring the risk in each market and as every economy is connected at the global level the risk of one market is reflected across the globe.
This model can be used as a guide in construction of the optimal portfolio but it should be supported with proper fundamental and technical analysis of the securities that are included in the portfolio. A portfolio constructed using this model does not guarantee the return but with continuous analysis, and valuation of the portfolio the investor will be able to maximize the return and minimize the risk in the investment.
Appendix
Table 9: Calculation of Co variance and Correlation Coefficient
Monthly return (Actual)
Expected return
Month
Maruti (Rs)
TCS (Rs)
Maruti (%)
TCS (%)
Probability
Maruti (%)
TCS (%)
30-Sep-18
-697.25
-7.65
-7.67%
-0.37%
0.0909
-0.70%
-0.03%
31-Aug-18
-424.15
138.2
-4.46%
7.12%
0.0909
-0.40%
0.65%
31-Jul-18
694.95
92.45
7.87%
5.00%
0.0909
0.72%
0.45%
30-Jun-18
288.4
106.7
3.38%
6.13%
0.0909
0.31%
0.56%
31-May-18
-277.75
-25
-3.15%
-1.42%
0.0909
-0.29%
-0.13%
30-Apr-18
-46.15
341.48
-0.52%
23.97%
0.0909
-0.05%
2.18%
31-Mar-18
10.15
-92.96
0.12%
-6.13%
0.0909
0.01%
-0.56%
28-Feb-18
-658.75
-38.65
-6.93%
-2.48%
0.0909
-0.63%
-0.23%
31-Jan-18
-219.85
205.58
-2.26%
15.22%
0.0909
-0.21%
1.38%
31-Dec-17
1,130.45
32.1
13.15%
2.44%
0.0909
1.19%
0.22%
30-Nov-17
387.85
6.5
4.72%
0.50%
0.0909
0.43%
0.04%
Standard deviation
0.061
0.082
Total
0.39%
4.54%
Covariance
0.0002
Weight
0.5
0.5
Correlation Coefficient
0.0367
Expected return
0.19%
2.27%
* Source: Developed by author
*Data collected from “Top Stock Research” on monthly basis
*Probability in the data above is assumed by the author as (1/11 = 0.0909)
Table 11: Risk, Return and Sharpe ratio of various combination of the three assets:
HDFC
Sun Pharma
Coal India
Risk
Expected return
CML
Sharpe ratio
0.00%
0.00%
0.00%
0.000%
0.64%
0.64%
0.00000
100.59%
132.82%
-133.41%
13.669%
1.399%
3.245%
0.05550
96.14%
123.35%
-119.48%
12.467%
1.384%
3.016%
0.05967
91.68%
113.88%
-105.56%
11.272%
1.369%
2.788%
0.06469
87.23%
104.40%
-91.63%
10.088%
1.354%
2.563%
0.07082
82.77%
94.93%
-77.70%
8.920%
1.340%
2.340%
0.07844
78.32%
85.46%
-63.78%
7.773%
1.325%
2.121%
0.08812
76.09%
80.72%
-56.81%
7.211%
1.318%
2.014%
0.09396
73.86%
75.99%
-49.85%
6.660%
1.310%
1.909%
0.10064
71.64%
71.25%
-42.88%
6.121%
1.303%
1.807%
0.10829
69.41%
66.51%
-35.92%
5.599%
1.296%
1.707%
0.11707
67.18%
61.78%
-28.96%
5.099%
1.288%
1.612%
0.12710
64.95%
57.04%
-21.99%
4.629%
1.281%
1.522%
0.13844
62.73%
52.30%
-15.03%
4.197%
1.273%
1.440%
0.15093
60.50%
47.57%
-8.07%
3.817%
1.266%
1.367%
0.16402
58.27%
42.83%
-1.10%
3.506%
1.259%
1.308%
0.17647
56.04%
38.10%
5.86%
3.284%
1.251%
1.266%
0.18617
53.82%
33.36%
12.82%
3.169%
1.244%
1.244%
0.19059
51.59%
28.62%
19.79%
3.173%
1.237%
1.245%
0.18801
49.60%
24.33%
26.07%
3.279%
1.230%
1.265%
0.17993
45.38%
15.51%
39.11%
3.763%
1.216%
1.357%
0.15310
43.23%
10.90%
45.87%
4.122%
1.209%
1.426%
0.13804
41.58%
7.17%
51.25%
4.446%
1.203%
1.487%
0.12669
40.11%
3.97%
55.92%
4.749%
1.198%
1.545%
0.11756
38.70%
1.12%
60.17%
5.037%
1.194%
1.600%
0.10995
37.53%
-1.63%
64.10%
5.316%
1.190%
1.653%
0.10339
36.28%
-4.11%
67.83%
5.585%
1.186%
1.704%
0.09771
26.16%
-25.37%
99.21%
8.042%
1.153%
2.173%
0.06374
17.43%
-43.86%
126.43%
10.312%
1.124%
2.605%
0.04692
9.25%
-61.38%
152.13%
12.511%
1.097%
3.024%
0.03650
1.28%
-78.36%
177.08%
14.670%
1.070%
3.436%
0.02932
-6.46%
-95.12%
201.58%
16.810%
1.044%
3.844%
0.02405
-14.22%
-111.60%
225.82%
18.933%
1.019%
4.248%
0.02000
-21.74%
-128.10%
249.85%
21.051%
0.993%
4.652%
0.01677
-29.41%
-144.36%
273.77%
23.157%
0.968%
5.053%
0.01415
-36.96%
-160.61%
297.57%
25.260%
0.943%
5.454%
0.01198
-44.60%
-176.72%
321.32%
27.356%
0.917%
5.854%
0.01014
-52.13%
-192.86%
344.99%
29.451%
0.892%
6.253%
0.00857
-59.77%
-208.87%
368.64%
31.540%
0.867%
6.651%
0.00721
* Source: Developed by author based on template available at
people.maths.ox.ac.uk/~howison/o10/excel/portfolio.xls (Retrived on 23 July 2019)
Table 12: Constants used in construction of CML
Market price of risk (Slope)
0.19059
Risk free rate
0.64%
*Source: Developed by author for the purpose of research
References
Impact of Flow of FDI & FII on Indian Stock Market Dr. Syed Tabassum Sultana, Prof. S Pardhasaradhi
Nupur Gupta, Comparative Study of Distribution of Indian Stock Market with Other Asian Markets. International Journal of Enterprise Computing and Business Systems, ISSN (Online): 2230-8849, Vol. 1 Issue 2 July 2011.
CAPITAL ASSET PRICING MODEL IN BUILDING INVESTMENT PORTFOLIO
Case: A comparison between two portfolios combine stocks from same and different industries. LAHTI UNIVERSITY OF APPLIED SCIENCES, Degree program in International Business, Thesis, Autumn 2014
10 Biggest Stock Exchanges In The World: Here’s How Much They’ve Gained In 2017
Rakesh Kumar and Raj s Dhankar (2008) Portfolio Performance in relation to Risk and Return and effect of diversification: A test of market efficiency, Applied Finance, IUP Publications New Delhi
NewsBusinessMarket Sensex sheds 24.6 per cent in 2011-B. S Srinivasalu Reddy, 31-12-2011